Foodservice Consumer Confidence Survey is now available for September 2024

WHAT IS NPD-MINGORA SALESTRACK?

SalesTrack® is the only weekly restaurant industry data report in the GCC, now recognized as an industry standard. It provides continuous tracking of sales and transaction data for chain restaurants on a comparable store basis, helping you stay ahead with real-time insights.

With over 30 years of data, SalesTrack® covers global markets including the US, Canada, Germany, France, UK, Spain, Austria, and now the UAE and KSA. Over 120,000 stores worldwide report data weekly, including 1,500+ stores in the UAE and KSA, representing 40+ top fast food and casual dining chains.
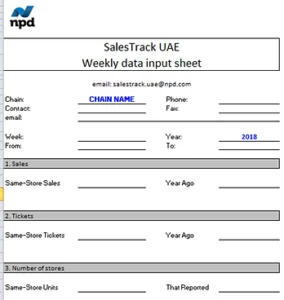
How It Works

Sunday to Saturday: Stores generate guest count and sales data.

Sunday to Tuesday: Participating chains submit their weekly sales and guest count data.

Wednesday: NPD validates and consolidates the data.

Thursday: Weekly reports are available online for participants.

Key Metrics Tracked

Same-Store Sales vs. Previous Year

Same-Store Transactions vs. Previous Year

Segment Size and Trends: 8-week trend lines for sales, ticket counts, and average ticket by segment.

Confidentiality Guaranteed

All participant data is anonymized and aggregated to ensure confidentiality.

Segment-Specific Reporting

If enough chains from a specific segment (e.g., Quick Service or Casual Dining) participate, we can separate data to provide more targeted insights.

WEEKLY REPORT PRODUCTION

Sunday to Saturday

Stores are open and generate guest count and sales data

Sunday to Tuesday

Participating chains provide their results of the prior week to NPD based on a defined ‚data input sheet‘

Wednesday

NPD collects missing data and validates the results, data is consolidated and reports generated

Thursday

Weekly reports will be available online for participants

DATA INPUT SHEET WEEKLY REPORT

Participating chains email a ‘data input sheet’ 

to NPD by Tuesday night

  • Same-store-Sales vs. Previous year
  • Same-store Tickets vs previous year
  • Number of restaurants ‚same store‘             
  • Panel to select measures (Sales/Tickets) and time period (week vs YTD)
  • Chain Sales/Ticket Trends (anonymized)
  • Detailed segment size and trend information
  • 8-Week-Trend lines for Sales, Ticket Counts and Average Ticket on a same store basis by segment
  • Participating Chains

Confidentiality:

NPD certainly guarantees the confidentiality of your information. After your submission of the data, participants‘ data input will be anonymized and aggregated with the other participants data.

Setup of subsegments:

The first objective for us is to launch a service for the chain restaurant industry as a whole. In case there is enough participants representing a specific segment in the market (such as Quick Service or Casual Dining), we gradually separate these segments to allow a view of the total market vs the closer competitors.

download PDF

Please download our document to see specific data of the aservice and how we work.

Select the fields to be shown. Others will be hidden. Drag and drop to rearrange the order.
  • Image
  • SKU
  • Rating
  • Price
  • Stock
  • Availability
  • Add to cart
  • Description
  • Content
  • Weight
  • Dimensions
  • Additional information
Click outside to hide the comparison bar
Compare